
Sonification: The Music of Data
Sonification is the process of giving data an auditory representation for the sake of data analysis. In other words, it gives non-musical things a musical parallel in order for us to be able to parse through complex data. If I’m looking at a picture that you can’t see, I can describe it to you using words. I’ve transferred the image into an auditory representation. While that isn’t a perfect analogy of sonification, maybe it helps in the way of definition.
Audio can have certain advantages over visual. We perceive sound differently than we perceive images. Audio happens in time, in colors, in space, and in frequencies, these differences can give the listener a different perception on the dataset.
You are familiar with some simple, everyday forms of sonification. A clock will tick at one second intervals, and chime at either 15 minute or one-hour intervals. This gives an auditory cue to the listener that represents a piece of information – in this case: time. Another early example of sonification is the Geiger Counter, in which clicks represent the presence of radioactive materials.
But let’s look at some more complex datasets. How does sonification work when the data is dense?
The goal is to be as faithful to the data as possible. We aren’t constructing musical works that are “inspired” by the dataset. No, we want a musical representation that is as precise as possible. So. Data points are mapped to a particular auditory representative. This can be pitch, it could be timbre (such as a certain instrument), it could be any number of things. Tempo can be a variable for data, although it is often more helpful to have the data set at a constant tempo, so that the data has a certain “groove” – especially if one of the data points is days, months, or years. Perhaps we have a dataset that goes up and down – in this case, pitch could be a really good indicator. Furthermore, if we want it to represent equal increments, a scale like the whole tone scale can be helpful.
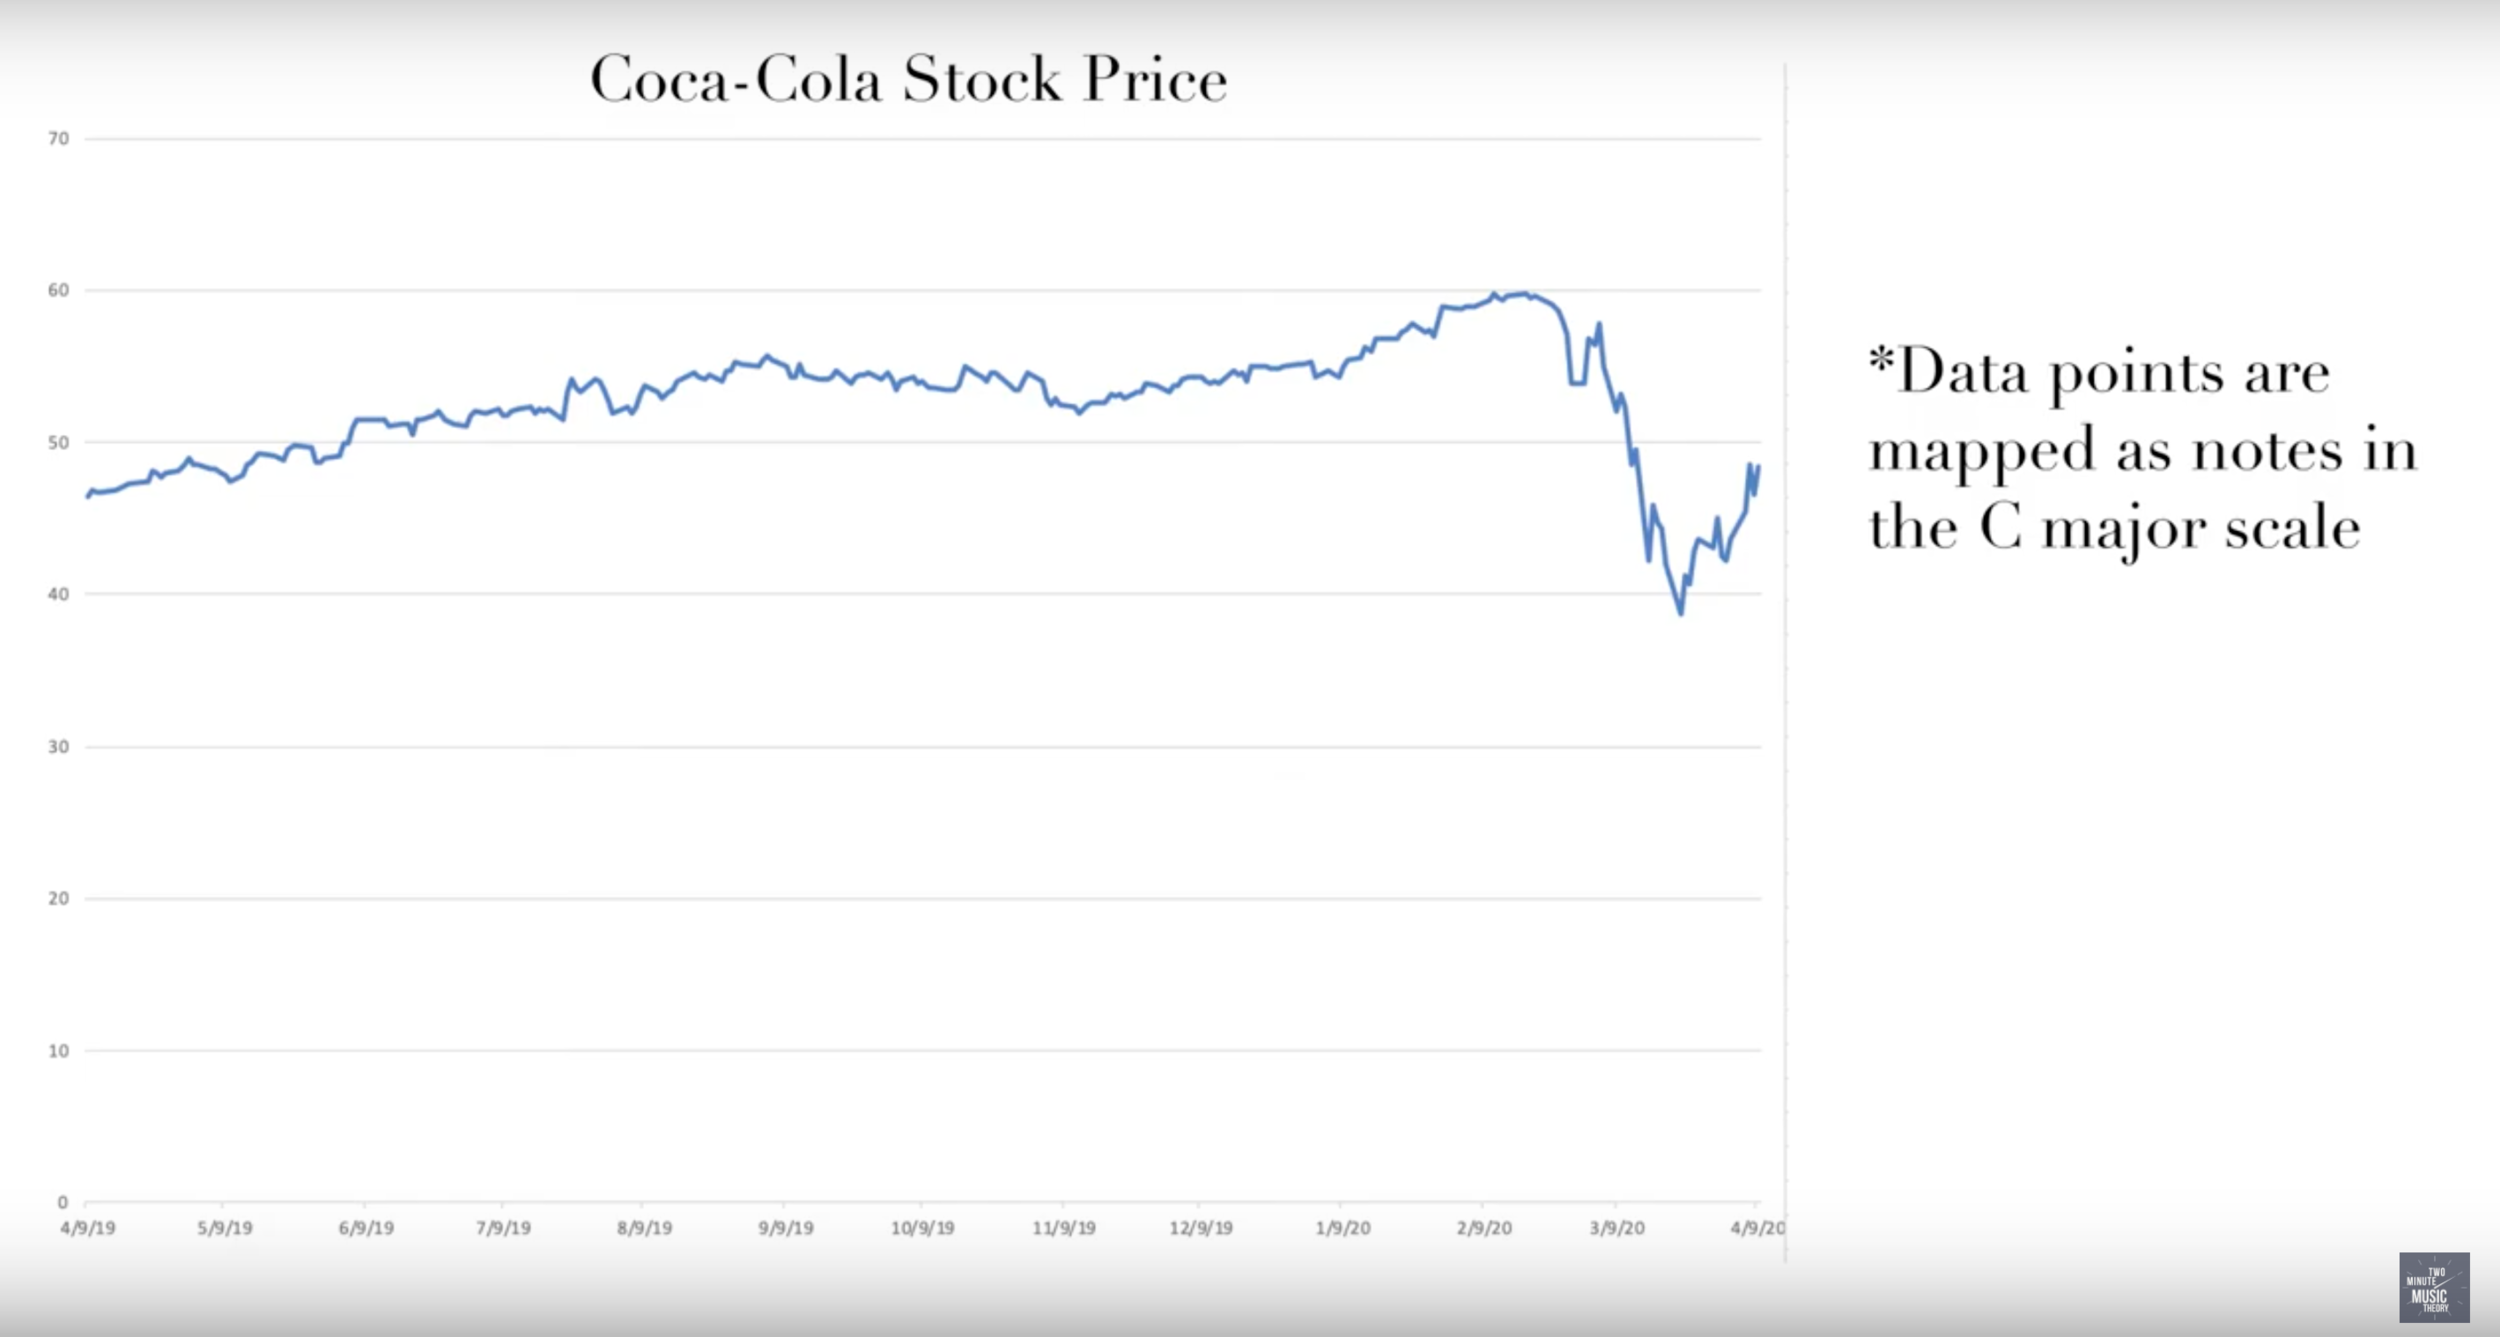
For example, one of the ways sonification is used is for Stock Market analysis. We could look at the data for a particular stock by assigning data points as specific pitches in the scale. Although here recently it probably just sounds more like a slide whistle.

We could also pit two or more stocks against each other. We can differentiate those stocks by using different instruments for each stock, while retaining pitch as representation for stock price.
Of course, sonification has more applications than just financial analysis. In 2017, composer Wayne Grim and the Kronos Quartet used data from various telescopes to sonify the 2017 Total Solar Eclipse.
And perhaps more relevant to current events, sonification has been a useful tool in DNA analysis. For example, we could map each of the four mononucleotide bases onto four musical pitches. This could produce a highly repetitive pattern, which means that aberrations in the pattern could indicate something like a genetic mutation.
Scientists and musicians in collaboration have recently created a sonification of the Covid-19 Virus. This sonification is an audio representation of the amino acid sequence and the structure of the spike protein which gives the coronavirus its name. I’ve placed a link in the description. It’s deceptively beautiful. This sonification will hopefully give researchers a new perspective on the structure of the virus and will allow them to study the virus quicker than simply looking at the data. Eventually, this might even possibly provide some insight for scientists on how to prevent the virus from infecting human cells.
